Profit & Loss statement also known as Income Statement is created according to the accounting standards set by FASB, IFRS, and GAAP Guidelines. An Income statement shows income and expenses incurred in a given accounting period.
What is a Profit & Loss Statement?

A profit and loss statement is a financial report that summarizes a company’s sales, expenses, and profits or losses for a given period. It helps the small businesses to keep track of their income and expenses in order to calculate profit and keep a check on their financial health and also to file final accounts with IRS.
Income statements can be prepared monthly, quarterly, or yearly.
Profit and Loss Statement is also known as:
- Income Statement
- Statement of operations
- Revenue Statement
- Operating statement
- P&L Statement
- Earning Statement
- Statement of Financial Performance
The profit and loss (P&L) statement is one of the three financial statements that every public company issues quarterly and annually, alongside the balance sheet and the cash flow statement. These financial statements ( Balance sheet, P&L statement, and Cash flow statement) together are used to provide the company’s overall financial performance. They are prepared using different types of accounting methods, such as cash and accrual methods.
Businesses compare P&L statements from different accounting periods because it makes the changes over time more significant than the individual numbers alone.
The main categories that can be found on the P&L include:
- Cost of Goods Sold (or Cost of Sales)
- Revenue (or Sales)
- Technology/Research & Development
- Selling, General & Administrative (SG&A) Expenses
- Marketing and Advertising
- Taxes
- Net Income
- Interest Expense
Income Statement vs. Profit and Loss: Are They the Same?
An income statement and a profit and loss statement are two names for the same financial report. There’s no difference between the income statement vs. P&L. This report may also be called a statement of operations, statement of financial results, earnings statement, expense statement, or operating statement. It gives stakeholders a clear understanding of the business’s financial health and whether it is generating a profit or incurring a loss.
The income statement shows the company’s capability to generate sales, manage expenses, and create profits. It is prepared based on accounting principles that include revenue recognition, matching, and accruals, which makes it different from the cash flow statement.
Balance Sheet vs. Profit and Loss Statement
A balance sheet is helpful when maintaining a cash flow statement, which details the money going in and out of the company. Balance sheets show whether the company has sufficient funds to pay bills when they come due. It gives an overview of the assets, equity, and liabilities of the company.
The balance sheet shows a company’s resources or assets and how those assets are financed—whether through debt under liabilities or by issuing equity, as shown in the shareholder equity section.
Among all these financial statements, the P&L is considered to be the most important because it shows a business’s ability to make a profit. It is a depiction of the entity’s revenues, costs, and expenses incurred during a specific period, usually a fiscal year or quarter.
These records provide information about a company’s ability to generate profit by increasing revenue, reducing costs, or both.
Types of Profit and Loss (P&L) Statements
Different types and formats of profit and loss statements exist. The net revenue amount is constant no matter the kind. However, the format significantly influences the type of information you may learn from the income statement.
1. Single Step Income Statement
A single-step income statement shows the revenue, costs, and eventual profit or loss that a firm has made. Due to the fact that they do not need to account for gross profit or cost of items sold individually, Small service businesses can adopt the single-step model.

2. Multi-Step Income Statement
An income statement with many steps summarizes a company’s revenues, costs, and total profit or loss for a certain reporting period. It is a more thorough substitute for the single-step income statement that computes a company’s net income using several equations.
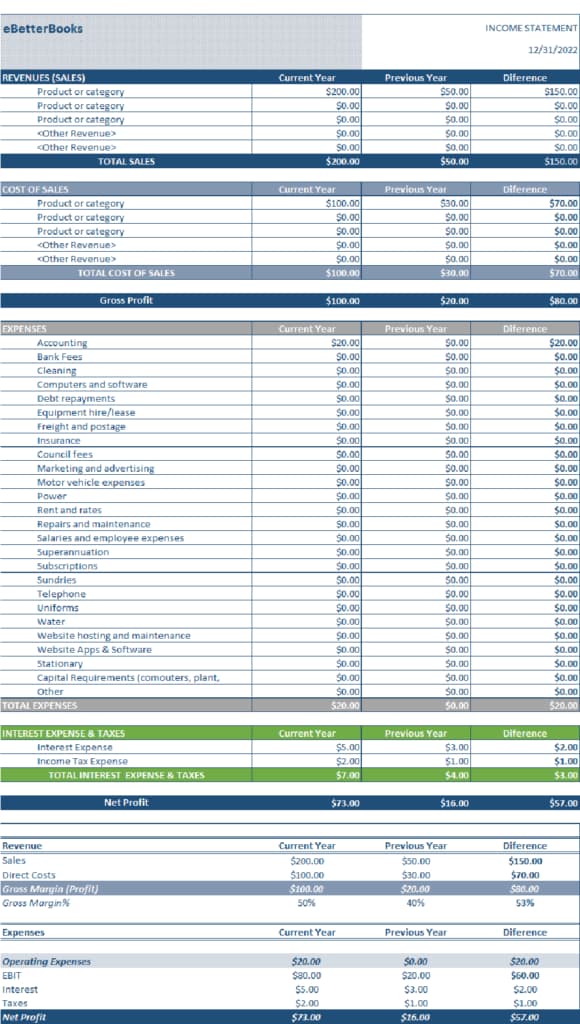
3. Comparative Income Statement
‘Multiple years’ results are listed in adjacent columns in this style of the income statement. Financial experts appreciate this style, which is frequently used in quarterly and yearly reports.

4. Common Size Analysis Income Statement
Each line item is shown as a percentage of a specified statistic, usually revenue, in the Common Size Analysis P&L Statement. This income statement helps compare a company’s performance to similarly situated but larger competitors.

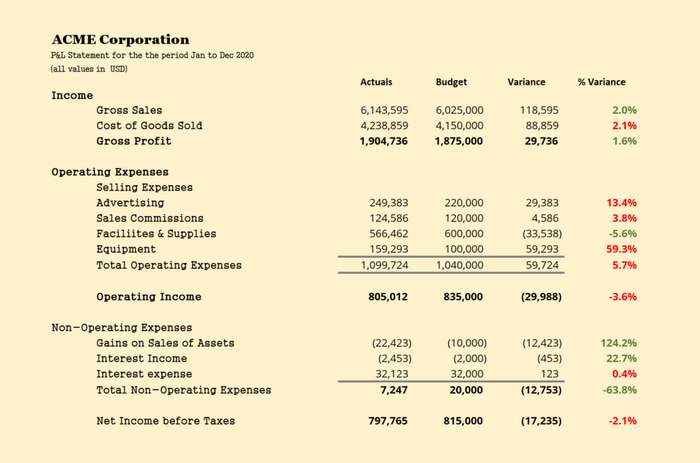
5. Variance P&L Statement
The Variance Profit & Loss Statement showcases performance against a specific benchmark. This benchmark can be a plan or a budget (used for internal reporting), or the prior period performance.
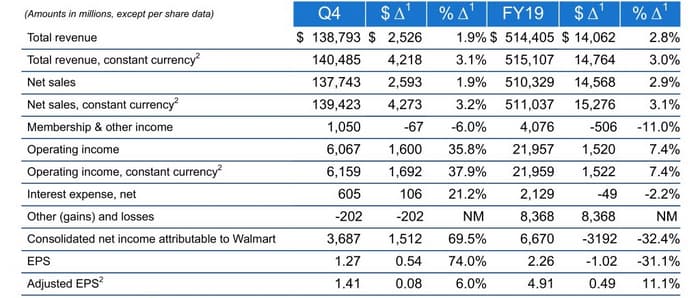
You may probably also see a variation of this statement in investor presentations as shown in the example below.
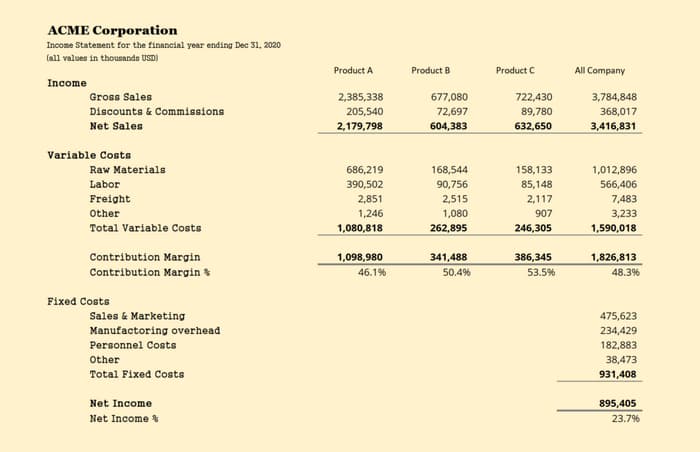
6. Segmented P&L Statement
The Contribution Margin P&L Statement is used to display profit contributions from various geographies, products, or business units. This template is for internal reporting purposes only.
7. Driver-Based P&L Statement
The Driver-based Profit & Loss Statement is preferred by management and strategy consultants. It is a forward-looking template that is often used for planning in industries such as mining. Instead of breaking down revenue and expenses into constituent GL account items, the critical value drivers of the businesses are shown.

8. Composite P&L Statement
The Composite P&L Statement is a type of its own. It rules the world of Excel and enterprise reporting and variations used by finance analysts to drive effective decisions. There is no single template for this type. Instead, you will see a mix of several items thrown together, which are as follows:
- Performance & variance tracked across several periods
- Column-level grand totals and totals
- Hierarchies in columns listing products or regions
- Row-level GL accounts leveraging hierarchies to drill down to several levels (not shown in illustration)
- A mix of financial & non-financial metrics (such as # of employees, production hours etc.) thrown in for reference
- References to other spreadsheet models and more

How to Create and Design a Profit and Loss Statement?
If you use accounting software like QuickBooks or Peachtree, the program will automatically generate the P&L statement for you once you enter your sales and expense figures, but you can easily create your own using a basic spreadsheet and easy calculations.
Creating a P&L statement can be easy if you regularly and accurately record your income and expenses in your accounting system. The accounting system generates your P&L on command.
If you want to create a P&L manually, the process is slightly more involved and time-consuming. To simplify the task, you can use a template.
Here’s step-by-step guide to create a profit and loss statement:
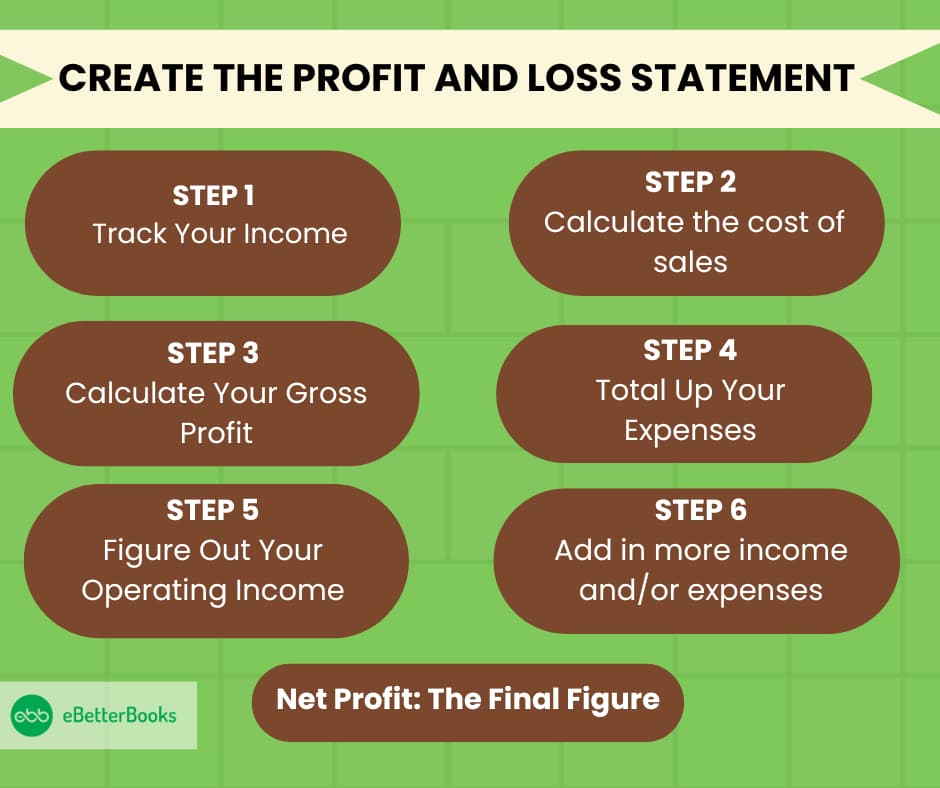
The monthly Profit & Loss (P&L) statement is useful to many small business owners. Understand how to read your P&L.
Step 1: Track Your Income
Revenue is the sum you make from selling goods and providing services. This will represent your overall operational income. Enter and keep track of the numbers as you get paid.
Step 2: Calculate the cost of sales
These are not the regular, set costs (such as rent, salary, etc.), but rather the expenses that change according to how much revenue you are generating. The price of products sold may also be used to refer to this.
These varying expenses may include inventory, raw materials for manufacture, and extra employees you hire to handle a busy time.
Step 3: Calculate Your Gross Profit
To get the gross profit of your activities for that specific period, subtract the cost of sales (those variable operational expenditures) from your total revenue.
Step 4: Total Up Your Expenses
These are the fixed costs necessary to operate your firm. They don’t significantly change from month to month or fluctuate depending on how many sales you make. Examples include costs for rent, employees, advertising, leasing equipment, and phones. Divide any annual expenditures, such as insurance, by twelve to determine your monthly outlay.
Step 5: Figure Out Your Operating Income
Subtract your overhead expenses from your gross earnings. Your operating income is the outcome.
Step 6: Add in more income and/or expenses
This would be money flowing in or going out that has nothing to do with how the firm is run. These expenditures would be financing charges and interest paid on loans, while revenue would be interest or profits from firm investments.
Your total pre-tax income, often known as your net profit, is the result of adding or deducting these from your operating income.
Net Profit: The Final Figure
This is the most significant overall figure and the major factor used to calculate all the line items mentioned above. This figure will indicate whether you are in black or red after covering your costs.

Why Are Profit and Loss (P&L) Statements Important?
Profit and Loss Statements are important for small businesses to understand their financial health. The purpose of the profit and loss statement is to outline a company’s revenues and expenses over a specific period, typically one fiscal year.
Profit and Loss Statements allow businesses to:
- Monitoring cost management – The costs are divided into areas like COGS and operating expenses in the statement, as this makes it easier for small businesses to understand how much money is being spent, where it is most cost-effective, and where possible savings can be made.
- Track financial performance – Businesses can compare their P&L statements across different periods (quarter-over-quarter, year-over-year) or with industry peers to evaluate performance and identify trends or areas for improvement.
- Identify trends and patterns – P&L Statements help businesses to identify trends, patterns, challenges, and opportunities.
- Make informed decisions – Management relies on the Profit & Loss statement to make informed decisions about pricing, investments, expansion, and cost-cutting initiatives. It shows the business’s operational efficiency and profitability. The P&L statement provides the data needed to make decisions about pricing, expenses, and resource allocation.
- Facilitate funding – When seeking funding for your small business, a well-presented P&L statement is essential to demonstrate that your business is a solid investment for stakeholders and partners.
- Tax reporting – The Profit and loss statement is important for accurate tax reporting. It helps businesses calculate taxable income and ensures compliance with tax regulations by providing a clear view of income and expenses.
- Stakeholder Communication – A clear and concise profit and loss statement helps businesses communicate their financial health to partners and stakeholders, encouraging transparency and trust among them.
- Lending and Creditworthiness – Banks and financial institutions use the profit and loss statement to determine a company’s ability to repay loans. A strong net profit increases the possibility of obtaining loans or credit lines.
- Financial Planning and Forecasting – Profit and loss statements are crucial for predicting future performance, creating budgets, and making financial forecasts. They enable businesses to plan for growth, expansion, or operational adjustments.
Structure of the Profit and Loss Statement
A month, quarter, or fiscal year is often the time covered by a company’s statement of profit and loss.
The P&L’s principal categories are as follows:
- Revenue
- Net Income
- Cost of Goods
- Taxes
- Marketing and Advertising
- Interest Expense
- Technology/Research & Development
- Selling, General & Administrative Expenses
Key components of a profit and loss statement for small businesses
1. Revenue
Revenue refers to the money that the business makes from delivering its goods, rendering services, or other activities that constitute the business’s major operations. It is also known as sales revenue or gross revenue.
In the income statement, the sales revenue is broken down as per the specified time. The revenue is usually calculated by deducting expenses from earnings.
2. Cost of Goods Sold (COGS)
Direct costs, also known as the cost of goods sold, are expenses solely attributable to the creation or marketing of a commodity or service.
These expenses cover direct labor expenditures and the price of the materials needed to make the product. Your direct expenses would include the price of buying the product from your supplier if you don’t make the one that you sell.
Basic Cost of goods sold Formula = (Beginning Inventory + Purchases) – Ending Inventory = COGS
Cost of goods sold in profit and loss account example
ABZ.com is a website offering high-end kitchen tables to its customers. The cost of a table is worth $1000 as of January 1, 2023. Throughout the year, the website ordered ten more tables from its supplier. By the end of the year (December 31), three tables remained unsold in the website’s inventory. Calculate the COGS.
Given :
Beginning Inventory = Cost of table * Number of tables
= $1,000 * 5
= $5,000
Purchases = Cost of table * Number of tables
= $1,000 * 10
= $10,000
Ending Inventory = Cost of table * Number of tables
= $1,000 * 3
= $3,000
Cost of goods sold (COGS) = (Beginning Inventory + Purchases) – Ending Inventory
= $5,000 + $10,000 – $3,000
= $12,000
3. Expenses
Any expense incurred to run the business is included in the profit and loss statement for small businesses. However, some other additional expenses may be included in the income statement, such as administrative expenses, selling expenses, COGS, taxes, electricity, employee compensation, etc.
Selling expenses in a profit and loss account are shown under the expense section, which includes salaries of sales people, travel expenses, shipping, advertising, freights, etc.
Expenses can be calculated using the following formula:
Total Expenses = Net Revenue – Net Income.
Expenses Example –
If the equity in a business increases from $200,000 to $800,000. It has a $1,200,000 total reported revenue. To determine the company’s total costs, we must evaluate its net income, as shown below.
Net income = $800,000 – $200,000 = $600,000
Total expenses = $1,000,000 – $ 600,000 = $400,000
Gross Profit
A company’s money after deducting its expenses for manufacturing, distributing, and offering its products or services is known as gross profit. As explained, gross profit is total sales less the cost of products sold for a firm.
Gross Profit Formula: Revenue – Direct Costs = Gross Profit
Gross Profit Example: A company paid a supplier $100 for each of the 100 bicycles the company bought, for a total of $10,000 in direct expenditures. The company made $395 from each sale, which amounted to $39,500 in sales. Your total revenue would be $29,500.
Net Profit or Loss
The net amount equals a company’s profit or loss for the period after determining any taxes owed and deducting them from pre-tax income. This establishes the “bottom line” of the P&L statement and demonstrates if and how lucrative your company is.
Net Income = Total Revenue – Total Expenses
Example: A candy manufacturing business spent $39,500 creating the candy, leaving a gross profit of $35,500. Operating income for the business was $23,000 after operating costs of $12,500. After deducting interest expenditure of $1,500 and adding interest income of $1,700, the candy company arrived at a net income before taxes of $23,200.
Disclosures required for Income Statement
Certain items must be disclosed separately in the notes (or the statement of comprehensive income), if material, including: (IAS 1.98)
- Restructuring of company activities and any reversals of provisions for the costs of restructuring
- Sales of investments
- Adjustments of inventories and property, plant, and equipment to their estimated realizable or recoverable values, including any reversals of such adjustments
- Settlements of legal disputes
- Sales of property, plant, and equipment
- Cessation of specific business operations
- Reversals of other provisions
Example of a Profit and Loss (P&L) Statement for small business
Company XYZ ltd is in the textile business and produces and sells various ready-to-wear items on the market. The firm has a policy of creating a monthly profit and loss statement and then, at the end of the fiscal year, a single profit and loss statement.
While the cost of products sold was only $60,000 in June 2019, the company made $100,000 on clothing sales. Additionally, the company earns $ 9,000 by selling the remaining fabric from creating the outfits and $ 4,000 in interest income.
On the expense side, the business pays $ 5,500 in rent for its space each month, $ 15,000 in compensation for manufacturing workers, $ 7,700 for yearly depreciation, and $ 9,000 for utilities.
Create the company’s profit and loss statement for June 2019, ending on June 31.
Company XYZ.Ltd.
Profit and loss Statement
For the Month Ending on 31st June, 2019
| Particulars | Amount ($) | Amount ($) |
| Revenues | ||
| Sales | $1,00,000.00 | |
| Scrap Sales | $9,000.00 | |
| Interest Income | $4,000.00 | |
| Total Revenue (A) | $113,000.00 | |
| Expenses | ||
| Cost of Goods Sold | $60,000.00 | |
| Rent | $5,500.00 | |
| Wages | $15,000.00 | |
| Depreciation | $7,700.00 | |
| Utilities | $9,000.00 | |
| Total Expenses (B) | $97,200.00 | |
| Net Income (A-B) | $15,800.00 |
The aforementioned Profit and Loss Statement for the firm XYZ Ltd. is created using the Single-Step Profit and Loss Statement technique, where all costs are recorded in the statement under a single, primary broad category without further subcategorization.
It is quick and simple to build because there is no need for additional categorization, which also saves time. As a result, for the month that ended on June 31, 2019, the business produced a net profit of $15,800.
Profit and loss statement template for small business
| Category | Amount ($) |
| Revenue | |
| Sales Revenue | |
| Other Income ( eg: interest, rental, income) | |
| Total Revenue | |
| Cost of Goods Sold | |
| Raw materials | |
| Direct Labor | |
| Other Production costs | |
| Total COGS | |
| Gross Profit | |
| (Total revenue – total COGS) | |
| Operating Expenses | |
| Rent | |
| Salaries | |
| Marketing | |
| Utilities | |
| Office Supplies | |
| Insurance | |
| Depreciation | |
| Other Operating Expenses | |
| Total Operating Expenses | |
| Operating Income (EBIT) | |
| (Gross profit – Total Operating Expenses) | |
| Other Expenses | |
| Interest on loans | |
| Taxes | |
| Other Miscellaneous Expenses | |
| Total Other Expenses | |
| Net Profit (or Net Income) | |
| (Operating Income – Total Other Expenses) |
How to read and analyze a profit and loss statement?
Studying a P and L statement may help you identify how your company is changing over time and when it has been most lucrative, even though it might appear like an intimidating pile of figures. Additionally, it can assist you in finding any possible problems with your cash flow.
When evaluating a P&L, bear the following points in mind.
Step 1: Look at your bottom line
The last line of your revenue statement shows whether your earnings were higher than your spending or vice versa.
Step 2: Review your sources of income and spending
It’s a good idea to look more closely at your income sources and costs after knowing whether your firm has generated any profit.
Step 3: Check your numbers
To determine if your profit or loss is a pattern or an aberration, it’s critical to compare your P&L statement to earlier intervals.
You may assess your progress toward your objectives by looking at the percentage change in each area. After you’ve made your comparisons, you’ll be better able to determine what is not working for your company and whether you need to make any adjustments in the future.
Step 4: Double-check your calculations
Double-check your calculations if you’re using an Excel spreadsheet to create and evaluate your P&L statement to ensure you didn’t forget anything or unintentionally alter a formula.
Manual data entry might occasionally result in errors that have an impact on your revenue. Reviewing your earlier statements might be helpful at this stage as well.
Analyzing a P&L Statement
A quick glance at a Profit & Loss shows whether the company is making or losing money. This is important when creating a comparative income statement, whether comparing a single business’s performance over multiple accounting periods or comparing one company’s performance to another.
There are different ways to analyze a Profit & Loss statement:
- Horizontal analysis, also known as series analysis, looks at changes over time within a particular line item. For instance, to calculate the percentage that revenue increases year-over-year for 5 years. Horizontal analysis helps you to see patterns, such as cyclical occurrences, and detect red flags (e.g., that COGS is too high).
- Vertical analysis, also known as common-size analysis, focuses on the relative size of expense items compared to a company’s revenue. For instance, how much is a company spending on marketing or research in relation to its revenue, and how is this trending over time?
How often are profit and loss statements calculated?
Profit and loss statements are often created weekly, quarterly, or annually. When asking for a small company loan, companies frequently need to present a history of their profits and losses for several years. The same is true when a firm is looking for investors to sell; interested parties want to examine P&Ls for several years to determine the business’s direction.
No need to create and submit a P&L to the IRS for tax law reasons. But the tax return is the P&L, showing the business’s earnings and annual outlays. However, there are discrepancies between the P&L and the tax return since not all costs are deductible on the return.
How Profit and Loss (P&L) Statements Work?
A business plan’s most well-known financial statement is often the P&L statement, which breaks down a company’s profit or loss.
The profit and loss (P&L) statement is a financial statement that summarizes the revenues, costs, and expenses incurred during a specified period. It is one of three financial statements that every public company issues quarterly and annually, along with the balance sheet and the cash flow statement.
Profit and Loss statement for a small business operates as follows:
The top line, which represents the entry for revenue, is the starting point from which the bottom line, which includes operational expenditures, tax charges, interest expenses, cost of products sold, and other costs of running a company, is subtracted. Net income, also known as profit or earnings, is the difference, often known as the bottom line.
Comparing P&L Statements
Comparing income statements from several accounting periods is crucial. This is because trends in sales, spending on research and development (R&D), operational expenses, and net income are more important than the raw figures.
Investors might further assess a firm’s financial health by comparing its P&L statement to another similar-sized company in the same industry. For instance, doing so can show that one firm manages expenditures more effectively and has a higher potential for development than the other.
FAQs!
Where can I get profit and loss statement?
The P&L may be found in the yearly financial reports distributed to shareholders by law and issued by all publicly listed corporations.A company’s P&L statement, balance sheet, and cash flow statement are all included in annual financial reports. On a company’s website, you may get financial statements.
Is profit and loss the same as income statement?
Yes, because it displays a business’s sales, costs, and profitability over time; profit and loss are also commonly referred to as an income statement.
Does a sole proprietor need a profit and loss statement?
Even if there is no legal necessity that you submit a profit and loss statement to any regulatory body, you should nevertheless think about doing so so that you are fully aware of the financial situation of your small business.
Can an accountant do a profit and loss statement?
Yes, an accountant can prepare a profit and loss statement since he understands the major accounting policies. This knowledge not only helps accountants prepare financial statements but also helps management make decisions about amounts and disclosures.
What Is the Difference Between a P&L Statement and a Balance Sheet?
The difference between a P&L statement and a Balance sheet is that the P&L statement summarizes the company’s cost, expenses, and revenue over a period of time, whereas a balance sheet displays the company’s assets, liabilities, and equity at a specific point in time.
Are All Companies Required to Prepare P&L Statements?
P&L Statement is prepared by publicly traded companies, private companies, small businesses and sole proprietors, non-profit organizations, Partnerships and Limited Liability Companies (LLCs), Self-Employed Individuals and Freelancers.
Income Accounts vs Expenditure Accounts
The income account records the revenue such as COGS, service revenue, or net sales, whereas the Expenditure account records the expenses such as rent, utility bills, debts, inventory, and hardware and software.
