What is CVP Analysis?
CVP, or Cost-Volume-Profit Analysis, is a tool commonly used by management to understand the relationship between costs, sales volume, and profit. By considering these relationships, CVP assists business people in making good decisions about controlling costs, producing a range of products, and setting market prices. Its main use is to determine the required sales volume to break even or achieve a targeted profit level.
In operational cost management, CVP analysis is essential for estimating profits, planning sales activities, and determining cost influence or new costs. It offers a practical way of ascertaining a firm’s financial framework to address risks and make the right decisions.
Key Components
CVP analysis tends to focus on how variations in cost, sales volume, and price impact the profit-making capacity of the firm.
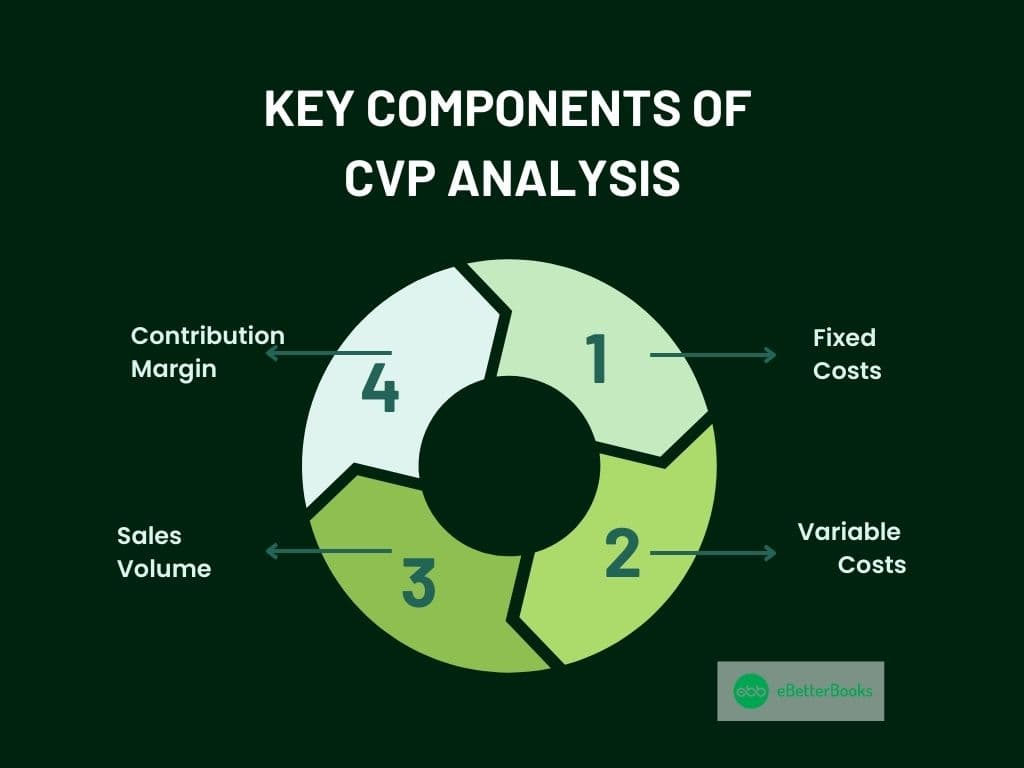
The analysis relies on four key components:

- Fixed Costs: Overhead costs are those that do not change directly with fluctuations in production output (e.g., rent).
- Variable Costs: Variable costs include any cost that fluctuates with activity level, such as the cost of raw materials.
- Sales Volume: The number of units sold.
- Contribution Margin: Net income left after the cost of sales has been excluded from the total sales revenue.
CVP analysis is a tool that helps businesses dissect cost-behaviour relationships to establish an organization’s break-even point, predict profits, and assess the effects of different strategies. Due to its ability to translate complicated financial information into easy-to-understand plans, it is a quintessential tool in financial management.
Steps for Profit Forecasting Using CVP Analysis
Below are the steps to forecast profit using CVP analysis:
Step 1: Collect Financial Data
To perform this analysis, the following key information should first be collected: fixed costs, variable costs per unit of product, and the selling price per unit of product. This is particularly important when data must be collected to make accurate predictions.
For example, if break-even calculations are being made, understanding flow costs and total fixed costs, such as rent and utilities, becomes paramount.
Step 2: Calculate Key Metrics
Contribution Margin = Selling Price Per Unit – Variable Cost Per Unit
This work shows exactly how much each unit contributes towards meeting the fixed costs.
Contribution Margin Ratio = Contribution Margin / Selling Price
This ratio assists in determining the extent of profitability to its sales.
Step 3: Calculate Break-Even Point
Formula:
Break Even Sales Volume = Fixed Costs / Contribution Margin per Unit
The break-even point reveals the level of sales that can only bring adequate cash to cover all expenses. For instance, for fixed costs of $30000, the contribution margin is equal per unit and is $40; the break-even sales level is 750.
Step 4: Target Profit and Forecasting Sales
Formula:
Target Sales Volume = (Fixed Costs + Target Profit) / Contribution Margin per Unit
Applying the following formula will help determine the volume of sales required to achieve a certain profit target. For instance, to obtain a profit of $50,000 with a fixed cost of $30,000 and a contribution margin of $40, the sales volume should be 2000 units.
Step 5: Analyze the Impact of Changes
CVP analysis should be used to predict the effect of cost, price, or sales volume changes on profit. For instance, serving more customers by raising the selling price increases the unit contribution margin and makes achieving profit targets with reduced sales volumes possible.
Practical Example
Scenario:
XYZ Sportswear sells running shoes, and it needs to predict the profit in the next quarter. Based on the given business information, the company has to get it right to the necessary volume to increase its profit to $50,000.
Key Data:
Selling Price per Unit: $100
Variable Cost per Unit: $60
Fixed Costs: $30,000
Step 1: Compute the CM by unit
Contribution Margin per Unit = Selling Price Per Unit – Variable Cost Per Unit
= 100 – 60
Step 2: Calculate Sales Volume to Break Even
Break Even Sales Volume = Fixed Costs / Contribution Margin per Unit
= 30000 / 40 = 750
That means a company can sell as many as 750 units per month to accommodate the fixed and variable costs without making a profit.
Step 3: Calculate the Sales Volume for Target Profit Locally and Internationally
Target Sales Volume = (Fixed Costs + Target Profit) / Contribution Margin per Unit
= (30000 + 50000) / 40 = 2000
Step 4: Forecast Profit
For XYZ sportswear to realize a profit of $50000, it must sell 2000 running shoes in the next quarter.
Step 5: Analyze Scenarios
If the company increases the selling price to $110, the contribution margin rises to $50, reducing the target sales volume to:
(30000 + 50000) / 50 = 1600 units
If variable costs rise to $70 per unit, the contribution margin decreases to $30, increasing the target sales volume to:
(30000 + 50000) / 30 = 2667 units
This CVP analysis enables XYZ Sportswear to fix achievable sales levels, evaluate the response to cost and price variations, and determine the marketing strategies to meet its desired profit level.
Real-Life Application of CVP Analysis
CVP analysis is useful in a lot of business scenarios to help you make a sound decision.
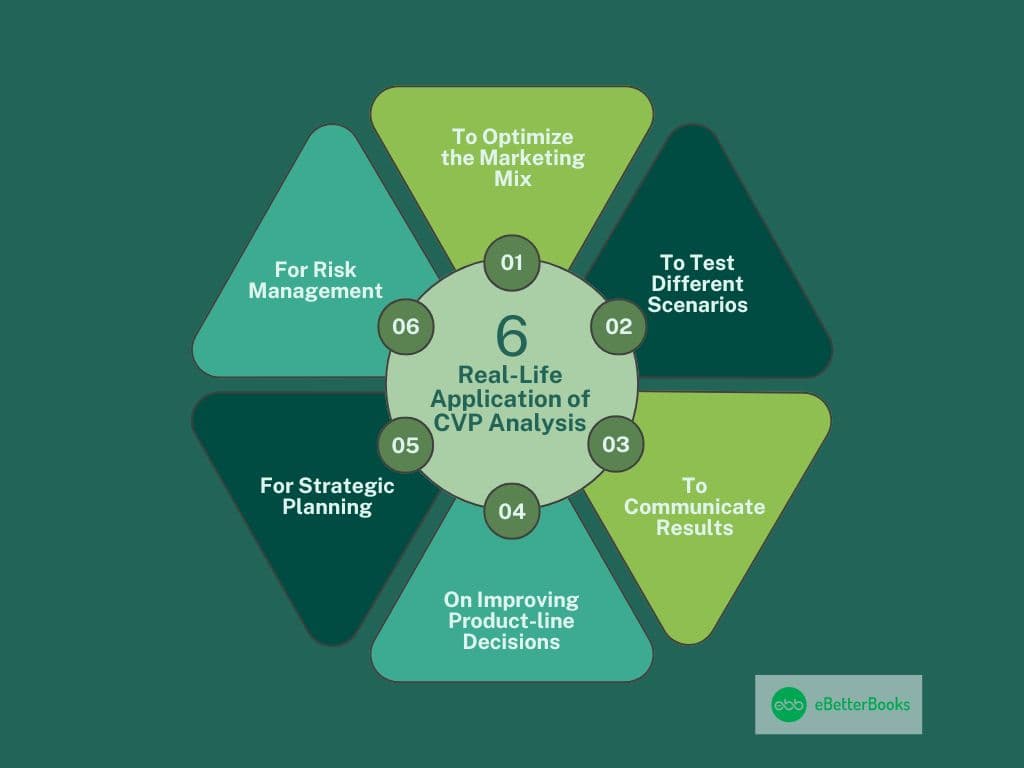
Below are a few uses:

- To Optimize the Marketing Mix: The CVP analysis can assess the level of profit generated by distinct marketing strategies. For example, firms can examine the overall revenue resulting from higher promotion spending to determine whether they are breaking even with the extra spending.
- To Test Different Scenarios: Nobody wants to be a winner; therefore, use best, worst, and even chances of winning to predict a financial position. For instance, a company can forecast what effect an increase in the cost of raw materials will have on profitability so as to make necessary adjustments.
- To Communicate Results: Provide a break-even chart to present financial data in an easily understandable manner to statement users. These charts can greatly improve communication, as they allow one to see how sales have grown, where costs have increased, and where profits exist.
- On Improving Product-line Decisions: Divide the products based on their contribution margin, eliminate low-contribution-margin products, and popularize high-contribution-margin products. For instance, stop selling unprofitable products that yield little profit; eliminating them has a net positive effect on the bottom line.
- For Strategic Planning: Many organizations use CVP to establish achievable sales goals and proportionate budgets. For instance, business organizations can incorporate data on break-even into operational development to expand operations or introduce new products.
- For Risk Management: Calculate the margin of safety to determine how much current sales can still drop before the company reaches its breakeven point. This information can help the business avoid risks or prepare for the worst in the market.
Conclusion
CVP Analysis is particularly helpful in making profit forecasts. Since the financial analysis results in an extensive and sometimes complicated set of data, it allows businesses to define specific break-even points, set specific sales goals, and evaluate the repercussions of particular decisions.
In addition to profit forecasting, CVP has applications in critical business areas as a tool for developing the marketing mix, testing marketing scenarios, and presenting easily understood results. It outlines a general pathway for future planning and risk assessment and is thus requisite for growth.
For CVP analysis to reach its optimum utilization, the business must incorporate the method within its operations and strategies management from decision-makers with a solid statistical background.
FAQs!
How do you calculate profit in CVP analysis?
For any business, profit equals the total of sales revenue less total cost (fixed cost + variable cost).
Alternatively, use the formula:
Profit = (Sales Volume x Contribution Margin per Unit) – Fixed Costs
What is the target profit in CVP analysis?
Targeting profit is the amount of profit that the business organization wants to realize.
It is incorporated into the CVP formula to determine the required sales volume:
Sales Volume = (Fixed Costs + Target Profit) / Contribution Margin per Unit
How can CVP analysis be used to predict future costs and profitability?
CVP analysis predicts future costs and profitability by:
- Static analysis and simulation of changes in fixed and variable cost and sales prices.
- Reviewing the effects of sales volume on break-even factors, as well as on profit.
- Estimating potential financial performances if the company has to operate under certain business conditions.
